- HOME
- Investor Relations
- Financial Data
- Key Financial Indicators
Key Financial Indicators
Financial Data
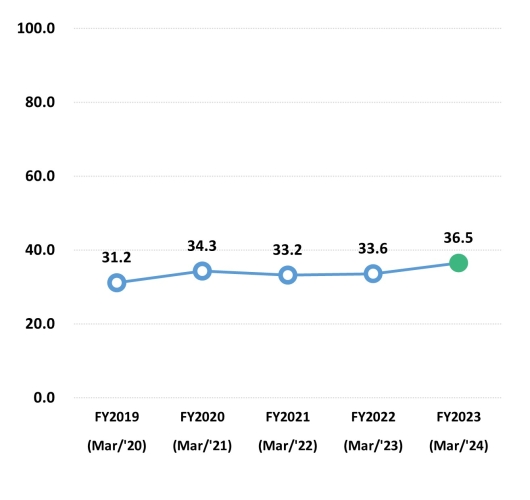
Equity capital to total assets (%)
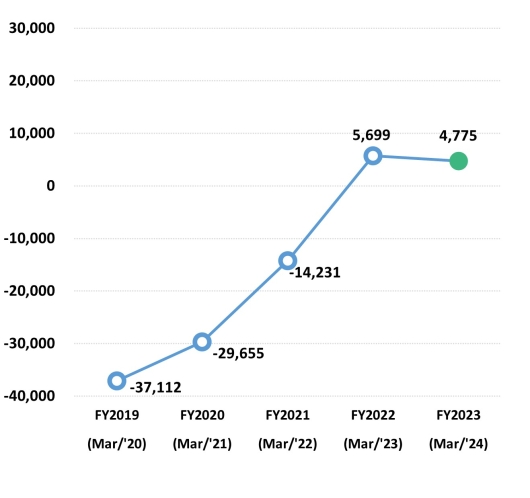
Free cash flow (millions of yen)
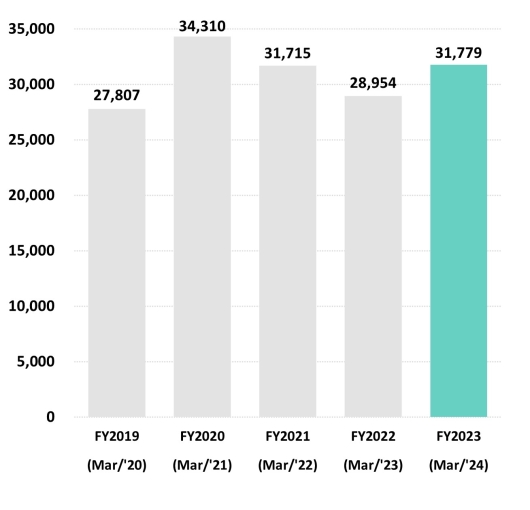
Depreciation expenses (millions of yen)
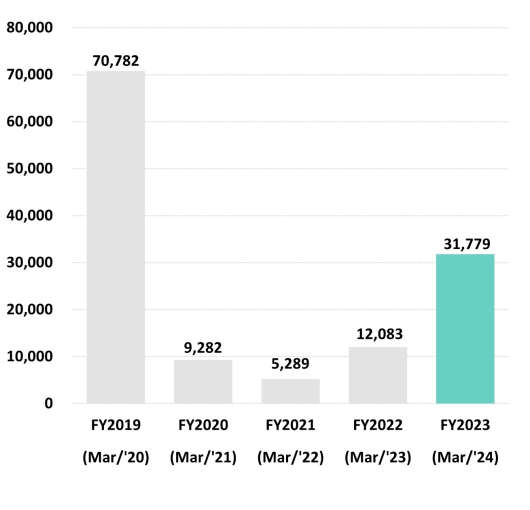
Capital investment (millions of yen)
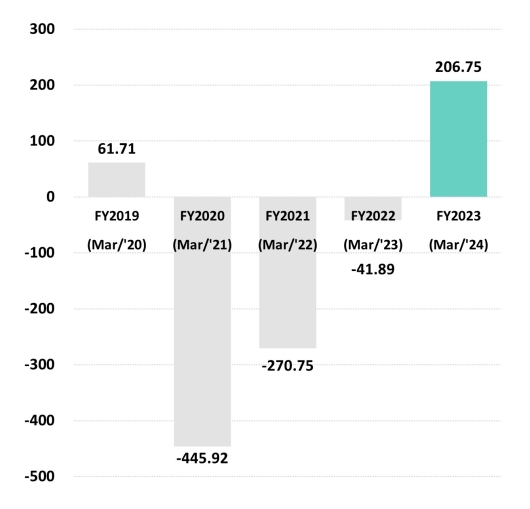
Net income (loss) per share (yen)
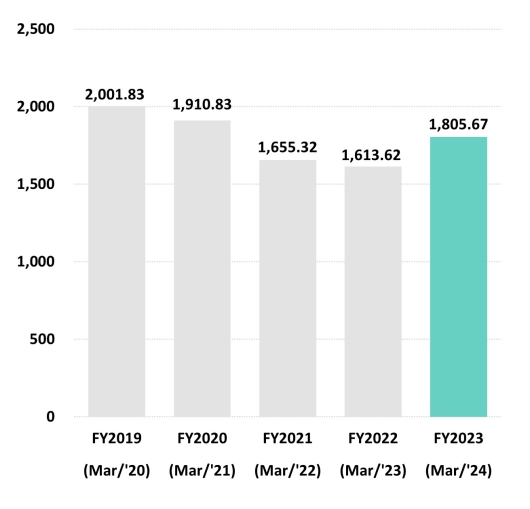
Net assets per share (yen)
| Item | FY2021 (22/3) |
FY2022 (23/3) |
FY2023 (24/3) |
FY2024 (25/3) |
FY2025 (26/3) |
|---|---|---|---|---|---|
| Equity capital to total assets (%)33.2 | 33.2 | 33.6 | 36.5 | 39.9 | 42.7 |
| Free cash flow (millions of yen) | -14,231 | 5,699 | 4,775 | 40,970 | 32,127 |
| Depreciation expenses (millions of yen) | 31,715 | 28,954 | 28,171 | 28,127 | 29,718 |
| Capital expenditures (millions of yen) | 5,289 | 12,083 | 31,779 | 26,191 | 32,276 |
| Net income (loss) per share (yen) | -270.75 | -41.89 | 206.75 | 295.61 | 313.95 |
| Net assets per share (yen) | 1,655.32 | 1,613.62 | 1,805.67 | 2,019.12 | 2,265.71 |